STEM 7.1 is planned for final release in April 2007, with headline features including
‘snapshot’ charts, sensitivity analysis and tornado charts, advanced depreciation
options, a new Break Even result, and the ability to automatically create Excel
named ranges from existing STEM data. The present article describes these new features
in more detail.
Generating snapshots of results
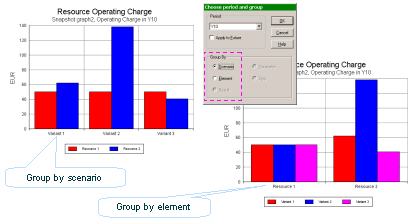
STEM now enables you to generate snapshots of results at a particular point in time.
Snapshots can be used to display results for different scenarios and elements, or
a number of end-of-project financial metrics for different scenarios.
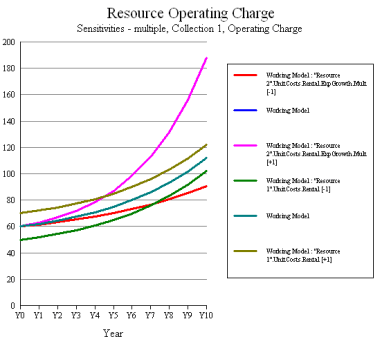
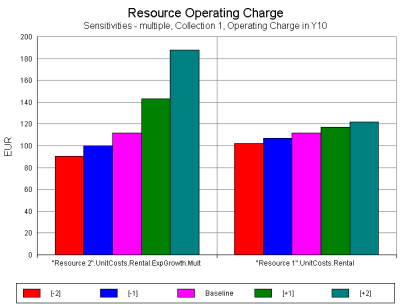
This is particularly useful when used with the new functionality for sensitivity
analysis (see below), as it enables you to examine complex sets of results that
would be impractical to show as complete time series.
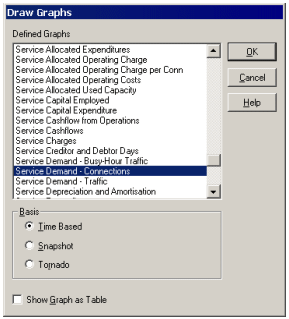
In the Results program, when you choose a graph to draw, the Draw Graphs dialog
has a new group of options which determine the basis on which a graph will be drawn.
The option Time Based will plot the results as a familiar time-series graph.
Trying to plot multiple sets of results on a single time-series chart is not practical
if there is too much information to present clearly. Instead, you can suppress the
time dimension and display a ‘snapshot’ of all the results at a particular time,
say the end of the model run. To do this, select Snapshot on the Draw Graphs dialog.
You can change the time period for the snapshot by right-clicking on the graph and
selecting Choose Period and Group from the pop-up menu. Alternatively, if you ask
to draw the same graph again, STEM will prompt you for a different period on the
graph. Using this method you can generate multiple snapshots of the same data, and
thus explore in detail the impact of varying the original input parameters.
If you select Tornado on the Draw Graphs dialog, STEM draws a ‘tornado chart’ showing
the results in a particular period sorted in order of decreasing significance. This
is a useful way of showing the sensitivities of results to variations in certain
parameters as described below.
Using Sensitivities to identify critical model assumptions
In developing a model, it is critical to explore the reliability and sensitivity
of certain input assumptions, to measure their relative impact on the results. For
some inputs, a variation in the value may have little effect on the results, whereas
for other inputs a small change can have a significant impact. Understanding the
relative sensitivity will help you to focus effort on making sure that these crucial
inputs are well-researched.
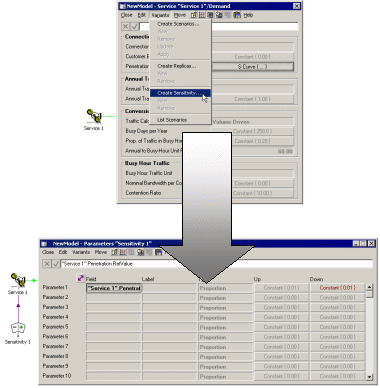
STEM 7.1 introduces a new Sensitivity element specifically designed to carry out
independent sensitivity analyses of various parameters with minimum modelling overhead.
The process of creating Sensitivities is very similar to creating scenarios, or
creating templates for template replication: they can be added directly from any
data dialog, using the Variants menu. The difference is that the parameters which
you identify with a Sensitivity are varied independently, and in turn; whereas Dimension
parameters are varied all together for a given scenario. By default each Sensitivity
parameter is varied in a single step by ±1%.
After running the desired sensitivities, you can use the familiar time-series charts
to examine results for limited sets of sensitivities.
However, it quickly becomes impractical to combine multiple sets of sensitivity
results on a single time-series chart: there is simply too much information to present
clearly. Instead, as described above, you can draw a snapshot of all the sensitivity
results at a particular time, such as at the end of the model run.
The default labels generated for sensitivity tests are somewhat cumbersome, and
you can replace these with custom names. These labels can also be used to group
together linked parameters, simply by using the same label to identify them. STEM
varies all the parameters within a single named group at the same time rather than
separately, and presents them within the Results program as a single coherent sensitivity
test. This is useful when carrying out sensitivity analysis on parameters such as
tariffs which are likely to be varied together, and is much easier than restructuring
the inputs to be driven from a common input.
STEM 7.1 can also present sensitivity results as a ‘tornado chart’ which plots separate
horizontal bars for each result in a particular period and sorts them in order of
decreasing significance. In a sensitivity analysis, this is a highly graphic way
to identify the parameters that have the most impact: the length of the horizontal
bars indicate the deviation, for each step, from the base-case results.
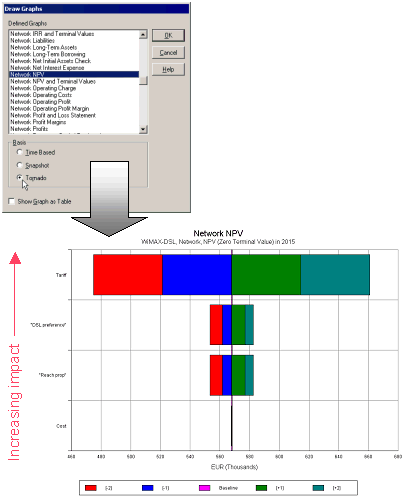
More than one Sensitivity set can be combined in a single tornado chart, so you
can create and retain a variety of different comparisons, e.g. demand versus cost,
or respective service penetrations, but still plot them all in a single tornado
to find the most critical inputs overall.
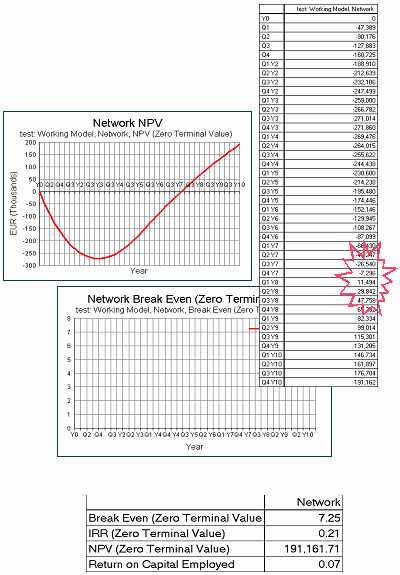
Reporting the break even point
A new derived result, Break Even, measures the elapsed time required for the NPV
to reach the break even point – that is, when the NPV crosses zero on the y axis.
This result is most useful in generating snapshot tables, as illustrated below:
Creating Excel named ranges from existing data
STEM 7.1 can automatically generate spreadsheet data in the right format to readily
link into STEM. This export feature is coupled with the option to link the STEM
model to the new spreadsheet so that the exported data become the live interface
for the relevant inputs. This is much quicker than creating such an input sheet
manually, and ensures that the right labels are in place and in the correct format.
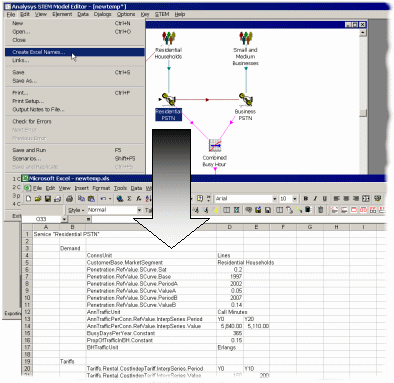
You can also export input data without linking the model to the resulting spreadsheet:
in essence, this is a way of obtaining a ‘print-out’ of the model in Excel.
New depreciation options
STEM 7.1 allows for various scenarios which will impact on the calculation of depreciation.
STEM now makes it possible to:
- assign a residual value to an asset
- specify a depreciation schedule as an explicit time series
- bring forward the depreciation schedule of an asset in a case where its business
life is re-planned (calendar override).
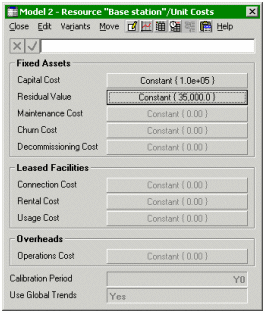
Residual value
When modelling the depreciation of an asset, its value is normally spread over a
period of time, at the end of which the asset is considered to have zero value.
However, it may be possible to sell the asset when it is no longer needed, in which
case the price obtained is the residual value of the asset. If you anticipate
being able to sell the asset, it would be unreasonable to depreciate more than the
difference between the initial value of the asset and the sell-on price (the residual
value), because the effective cost to the business is only the difference between
these. To capture this, a new input has been added to the Unit Costs dialog:
Depreciation is calculated based on an estimate of what the residual value will
be when a resource is removed from the network. However, this may occur earlier
than anticipated if the resource becomes redundant, in which case a correction may
be required to the final depreciation.
There are two new results:
- Proceeds from Sale of Assets is the positive cash flow item that arises
when the Resource is sold.
- Profit on Sale of Assets arises if the Resource is sold for more than its
net book value: it is equal to the cash received from the sale minus the written-down
value of the Resource after its final depreciation.
In addition, there are two new predefined graphs, Network Sale of Assets
and Resource Sale of Assets, that each include the two new results.
Depreciation schedule
When specifying how depreciation should be spread over the financial lifetime of
a Resource, in STEM 7.1 you can specify a Depreciation Schedule as an explicit
time series in the new Financial Details dialog. This feature allows you to match
any non-standard or statutory depreciation methods, such as the Modified Accelerated
Cost Recovery System (MACRS) used in the USA. For example, the following input would
defer depreciation for 2 years, until the Resource was actually operational. A constant
of 1.0 (the default) is equivalent to Straight Line depreciation.
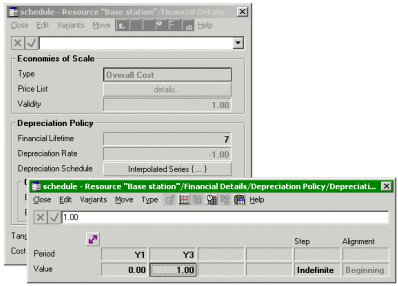
The Depreciation Schedule as entered is normalised in order to integrate to 1.0
over the financial lifetime.
Calendar Override
Calendar Override is provided as a way to revise the timing of depreciation in a
scenario where the business life of an asset is re-planned. For example, a resource
installed in Y1 may have been depreciated initially with a financial lifetime of
7 years, but then the availability of a new technology may lead management to plan
its early replacement. So in Y4 you may wish to bring forward the original depreciation
schedule, anticipating an earlier removal by the end of Y5.
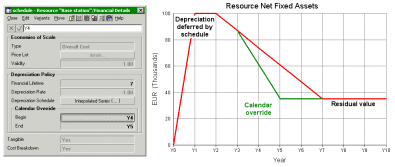
This Calendar Override applies to all installed ages of equipment: so newer equipment
in Y2 will be depreciated more quickly to satisfy the Calendar Override.
Additional refinements
-
 The
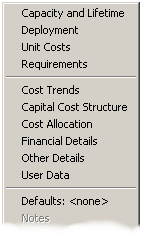
Resource pop-up menu has been redesigned. There is a new item, Financial
Details, which includes Economies of Scale and the new depreciation options (see
above). The order of the items on the menu has also been modified to better reflect
their importance.
The
Resource pop-up menu has been redesigned. There is a new item, Financial
Details, which includes Economies of Scale and the new depreciation options (see
above). The order of the items on the menu has also been modified to better reflect
their importance.
- Pre-run installation is now off by default. This means that if there is
any demand in the first period of a model run, STEM will install all equipment as
new by default. Set this input to Yes to automatically install a range of ages of
equipment, according to the per-resource Pre-run installation inputs, as in previous
versions.
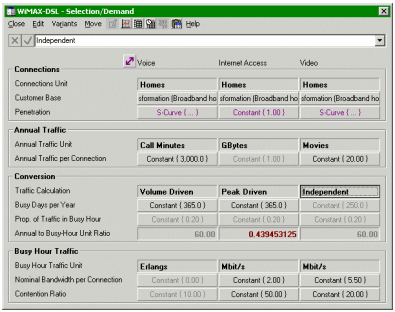
- There is a new Independent option for Traffic Calculation. For traditional
voice services, the calculation of the busy-hour traffic is Volume Driven, based
on the Annual Traffic input and the parameters in the Conversion group. STEM 7.0
made it possible to model data services directly: the Service Demand dialog provides
the option for the Traffic Calculation for a data service to be Peak Driven, based
on inputs for Nominal Bandwidth and Contention Ratio.
STEM 7.1 adds an Independent option for some media services where both peak and
traffic volume assumptions are known directly. This is for modelling situations
in which both the peak traffic and traffic volume can be estimated directly with
more confidence than any rule to relate them. For example, annual traffic volume
may be constrained independently by spending.
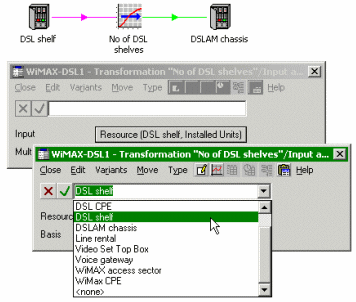
- There is an easier interface for linking Transformations. If you hold down
the Ctrl key then drag-and-drop one Transformation onto another, the dialog now
offers the option to Set Input. If this is selected, the dragged Transformation
is made an input for the target Transformation, similar to the way other elements
may be linked, for example Service to Resource.
- Element-choice drop-downs are sorted alphanumerically, and allow selection
by typing the first few characters of the element name.
- It is possible to define considerably more parameters as global user data:
STEM 7.1 allows up to 120 parameters.
- The External Links dialog (displayed by selecting Links… from the File
menu) is now ‘non-modal’. This means that you can still carry on working on a model
while this dialog is on.
- To complement the results for EBIT and EBITDA, two new results have been added which
express these measures of annual earnings as a proportion of the revenue: EBIT Margin
(equal to EBIT divided by Revenue) and EBITDA Margin (EBITDA divided by Revenue).
- In the Results program, the Choose Scenarios and Sensitivities to Draw
dialog is now re-sizeable. This is useful for viewing the full names of all the
scenarios in the list, even when these names are very long.
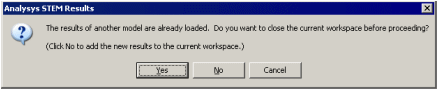
- Loading new results: if you have a set of results open and then run another
model, STEM needs to know whether to keep the previous results open. The wording
of the prompt has been made clearer (see below). Click Yes to close the previous
set of results and load the new set. Click No if you want to add the new results
to the currently active workspace, in order to view both sets of results simultaneously.