With the increasing prevalence of virtualised networks, the scope of network
business models is transported to the realm where the software is
managed and is either executed or orchestrated.
We have created a reference framework for modelling the IT value-chain in a web-scale
enterprise which extrapolates conventional revenue and cost modelling from the hardware
and site to value-added IaaS, PaaS and SaaS layers. This structure can then be used
to compare buy/build scenarios for delivering services built on either third-party
or in-house platform / infrastructure / physical data centres.
1. Network economics is increasingly focused on the data centre
The data centre is now ubiquitous in carrier and web-scale business infrastructures.
Very high speed fibre and all-purpose IP networking have driven an inexorable migration
of ‘the intelligence’ in a network from local offices to centralised
facilities which facilitate, as a consequence of their greater scale and smaller
number:
- higher equipment utilisation
- massive operational efficiency
- (ease of achieving) more consistent platforms
- faster response to configuration faults in higher layers.
The data centre is the new network for economic modelling and
business insights!
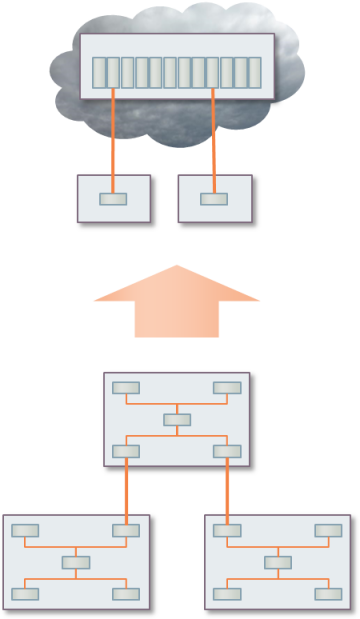
Figure 1: Inexorable migration of network intelligence from local offices to centralised
facilities
2. From hardware and site to IaaS, PaaS and SaaS layers
Running your own hardware may not be in vogue, but you need a model if you are going
to evaluate the alternatives. We have modelled the data centre as a value chain
to help determine at which layer you have the best scale to operate. The cost of
the raw physical assets may be compared with the price of consuming IaaS, and higher
layers in turn.
Physical layer:
- compute, storage and network
- building, power, cooling, UPS
- deployment, operations, security
|
IaaS:
- VMlarge, VMmedium,
VMsmall
- VMimage, storage
- VLAN, firewall, load balance, IP address, etc.
|
Paas:
- OS, scripting, web, database, etc.,
- running on elements of IaaS
|
Saas:
- managed email, backup, etc.
- running on elements of PaaS
|
Figure 2: Value-chain elements for a data centre offering SaaS, PaaS and IaaS services
Starting from the customer, the value-chain model considers:
- business applications, requiring
- platform elements, requiring
- VM configurations, requiring
- compute, RAM and storage resources in a data centre, plus
- space, power, cooling, etc., across
- multiple sites in global network
- ‘point and click’ scenarios; e.g., On premise
/ Cloud / Hybrid cloud
- multi-layered cost allocation, ‘out of the box’.
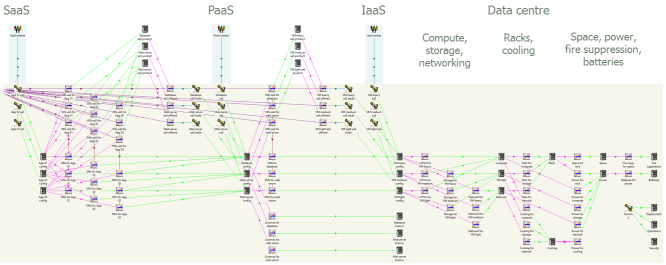
Figure 3: Connecting business applications with the value-chain elements of a physical
data centre
3. Build from products or components
It is an interesting question as to whether the economics are better for a platform
or software operator to build their solution on IaaS (or PaaS) rather than the raw
hardware:
- if an IaaS operator prices keenly, then their margin should
match the operational benefit for a client not having to maintain its own physical
assets and being able to focus on its main value-add
- however, the initial hype may have allowed operators to over price (they might say,
“to recoup R&D”)
- a fair deal should be negotiated
- a model is required to establish an objective reference point on pricing.
Our model uses scenarios to compare the following approaches:
- SaaS on PaaS
- SaaS on IaaS
- SaaS on physical
- PaaS on IaaS
- PaaS on physical.
The same structure can be used to evaluate which model to use for your own business
applications and activities:
- SaaS vs PaaS vs IaaS vs physical
- where do you have expertise/scale?
- what is your value-add/focus?
In order to properly evaluate a hybrid cloud scenario with a mix of third-party
platform/infrastructure aaS and in-house components,
it is necessary to model independent SaaS, PaaS and IaaS operators in parallel so
that each pool of resources achieves a level of utilisation reflecting the scale
of the owning operator. The results shown below compare in-house data-centre costs
with a mix of aaS product costs.
Understanding the value-chain in a data centre is fundamental.
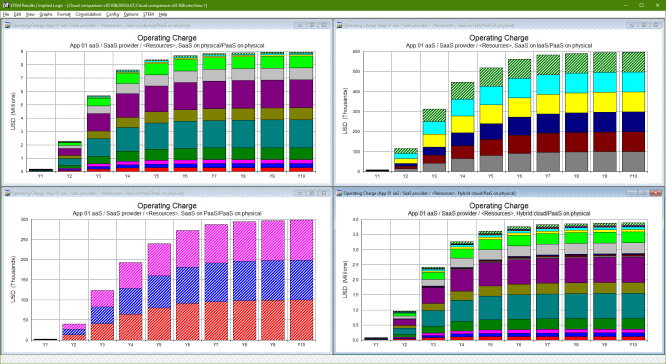
Figure 4: Systematic and consistent cost breakdown across different buy/build scenarios
4. De-composition of the model (incremental development steps)
You could say that this looks quite complicated! Actually,
none of the individual components is complicated at all. Even the appearance of
the operator ‘template driving itself’ is nothing special when you look
at it closely.
However, the model certainly didn’t happen all at once! Instead it started
with a sketch of the single-player technology stack. Visualising this in the Editor
made it easier to grasp the commercial structure and to consider how best to model
the multi-player context. The evolution we will follow in the remainder of this
article goes like this:
- the basic technology stack
- configuring a product from these basic ingredients
- a value chain as an alternative economic view
- scenarios for utilisation of platform resources
- modelling hybrid cloud
- replicating the solution stack for the different players
- seeing the template cross-linkage for what it is
- scenarios for the build options for SaaS and PaaS.
4.1 The physical technology stack
Processing in a data centre usually involves compute, storage and networking. These
in turn require racks and cooling. Racks require space and pretty much everything
requires power. Space requires fire suppression (and security and light and so on)
and power requires battery backup.
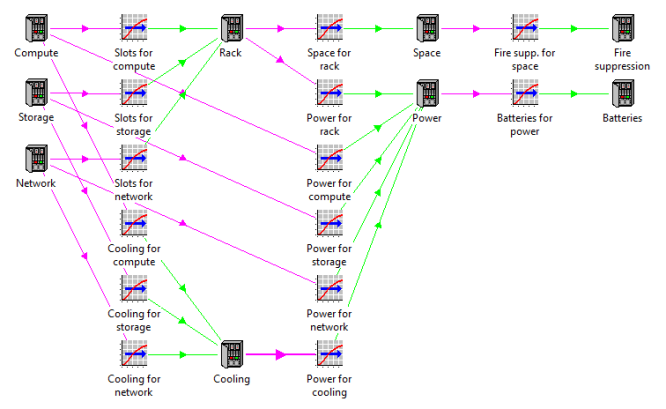
Figure 5: The physical technology stack
4.2 Configuring a product from these basic ingredients
A virtual machine (VM) may be defined in terms
of its compute, storage and networking elements. A range of configurations may be
offered at a certain price per performance.
A web server may be delivered on a particular VM
configuration, together with a suitable software licence. A
business application may combine any/all of these elements.
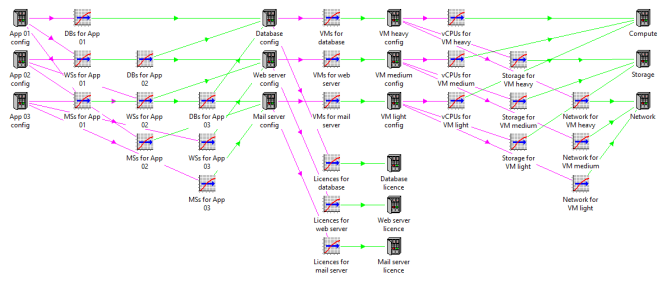
Figure 6: Configuring an application from platform, infrastructure and physical
elements
4.3 A value chain as an alternative economic view
If each layer of resources drives the next directly (i.e., via a series of transformations),
then every cost will be allocated and directly visible to the business application.
However, if a SaaS provider builds the app using VMs from a third party, then his
only concern is the VM subscription; the data centre costs are for the third-party
IaaS provider to worry about.
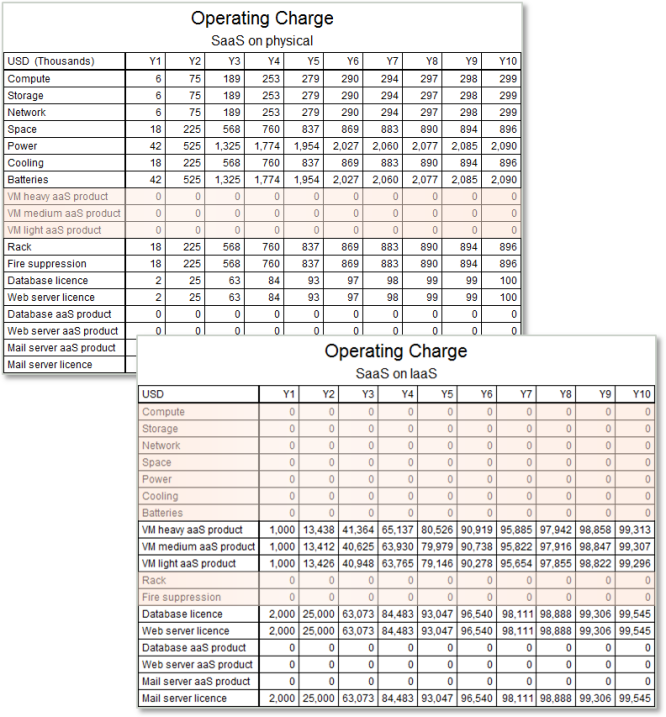
Figure 7: In-house and third-party aaS cost structures
compared
This approach can be modelled as a value chain
in STEM by inserting an extra service (IaaS provider) between a VM product resource
and its constituent resources in the data centre.
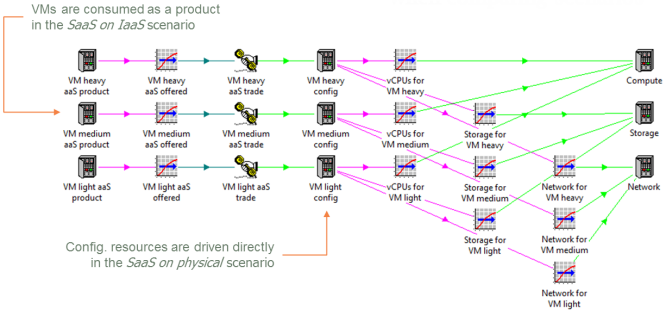
Figure 8: Value-chain elements in STEM
The ‘trade’ service must set the input Value Chain
= Commodity, and then:
- the revenue charged by the ‘trade’ service appears as an extra cost
with the ‘product’ resource
- the gap between revenue and cost (allocated from the data centre) is the margin
for the IaaS provider.
The original ‘config.’ resources are retained for build consistency
when comparing scenarios where they may also be driven directly by in-house build
transformations.
Note: Currently the ‘offered’ transformation must have Type = Resource.
4.4 Scenarios for utilisation of platform resources
To compare the case for SaaS on physical with SaaS on IaaS, you could just add the ‘product’
resources in isolation and set the rental cost to a market rate. However, the value-chain
approach demonstrates the profitability of the IaaS provider on an equivalent basis
(differing only in utilisation) that makes the overall comparison more credible.
Either way, all you need is a set of scenario parameters which control the VMs aaS for x transformations (i.e., the multipliers
for the VMs aaS for database / web server / mail server
transformations). Then the VMs for x transformations
are just defined as a ‘1–’ complement.
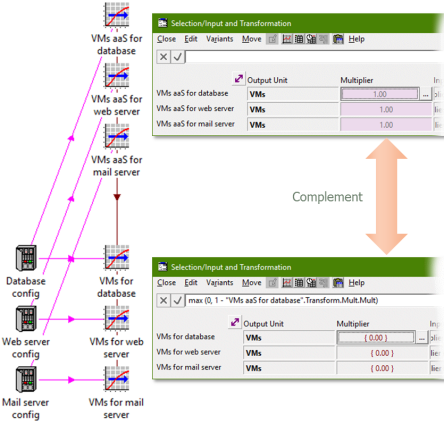
Figure 9: Scenarios for platform resources
What is actually going to make the VM products any cheaper when they are sold as
a service? Answer: economy of scale.
Where does that scale come from? Answer: a wider market.
So, an external customer base must be added to our SaaS on
IaaS scenario in order to deliver a lower unit cost (as an allocated
share of a greater overall cost). This requires a parallel set of external services,
since the value-chain services capture only the internal demand.
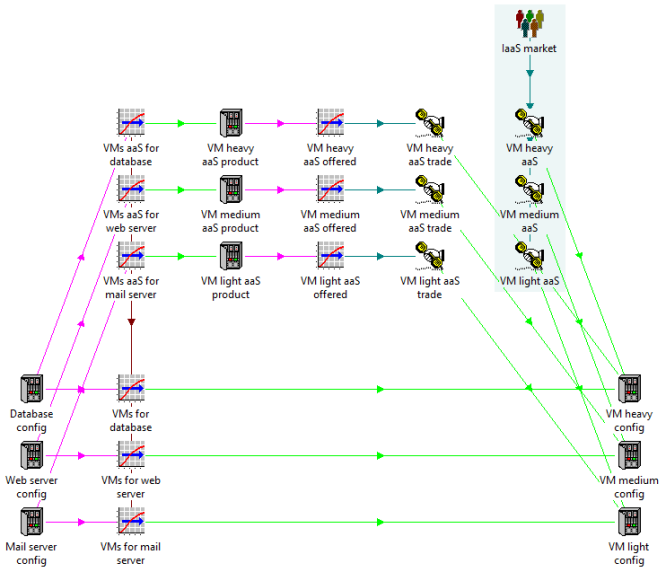
Figure 10: External market for platform resources
5. The case for hybrid cloud in a web-scale enterprise
Public cloud services offer great efficiencies through massive scale. They can also
offer on-demand flexibility at a better price than owning your own compute assets
which would only be used for a fraction of the time.
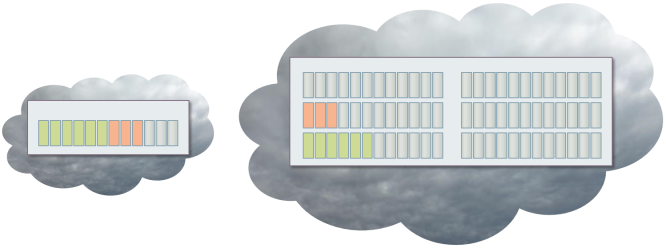
Figure 11: On-demand processing can be shared with other clients in a public cloud
Private cloud capabilities are less efficient and may be regarded as a non-core
business distraction, but may have to be part of the mix:
- due to regulations on sensitive customer or financial data
- due to cross-border privacy issues
- if custom processing is required.
How will you determine the best approach? The data-centre value chain is just right
for comparing the options:
- the public cloud approach may be characterised by the consumption of the relevant
SaaS, PaaS and IaaS services (mix of fixed and variable) with the consumed service
revenues as the effective cost
- the private cloud approach takes the same requirements and pushes them through to
the underlying hardware costs
- or you may consider a suitable public–private cloud split.
Whatever the technical options, a rational investor will increasingly demand to
see a robust illustration of the underlying economics!
5.1 Modelling hybrid cloud
The expected business results are a kind of compromise between:
- the more efficient cost of highly-utilised public cloud resources and
- the relative inefficiency/expense of a dedicated private cloud.
How can this model generate two different sets of utilisations for the same underlying
resources within a single consistent scenario? Answer: we need a separate perspective
for each provider:
- SaaS requires all layers
- PaaS doesn’t need SaaS (and doesn’t use PaaS)
- IaaS doesn’t need SaaS or PaaS (and doesn’t use IaaS).
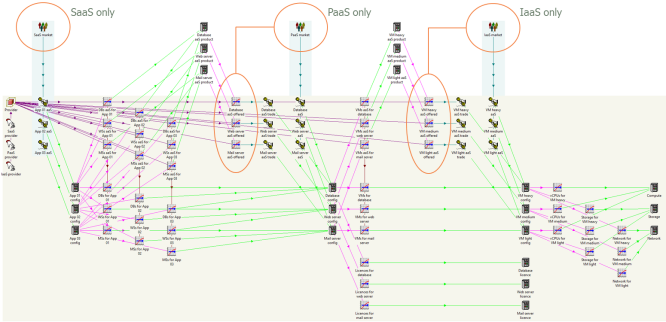
Figure 12: Different perspectives for each provider
We can use a template to replicate the entire single-player stack once for each
provider:
- disregard the layers not required
- identify which provider sells the product resources in each layer.
In a commercial model of specific cloud providers, there might be significant differences
in internal configuration of products which would provide a compelling reason to
model each provider explicitly. In contrast, the template gets the model built quickly
and provides an elegant way to highlight the impact of scale and sites alone.
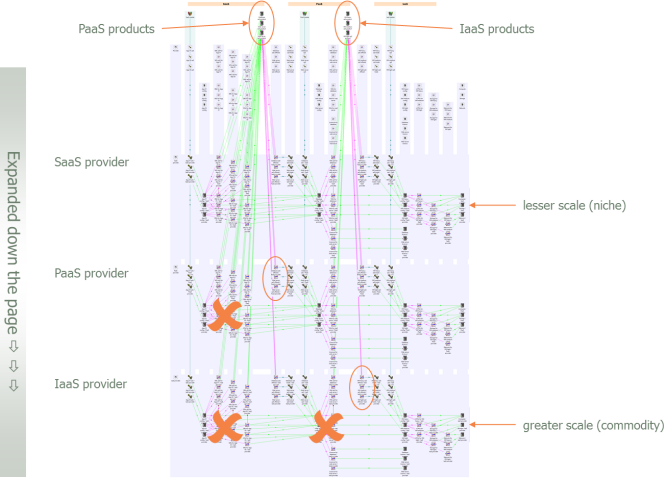
Figure 13: Replicating the solution stack for the different providers
5.2 Seeing the template cross-linkage for what it is
If you consider that the template appears to ‘drive itself’, then you
could be forgiven for thinking that the model might be circular.
However, this impression is an over-simplification: while it is true that some elements
of the template drive others of the same template, in fact the links are all ‘left
to right’ and nothing drives back to the start or input of the template.
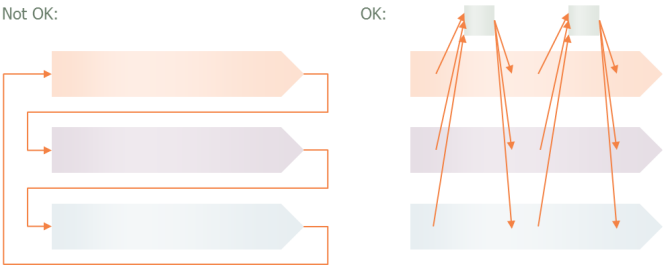
Figure 14: Different classes of template cross-linkage
5.3 Scenarios for the build options for SaaS and PaaS
Our template has parameters which govern (for each provider):
- the market for relevant service layers
- identification with the ‘trade’ demand from each previous layer
- the proportion of servers bought as PaaS products
- the proportion of VMs bought as IaaS products
In order to vary the build for both the SaaS and PaaS providers, we can introduce:
- scenarios for both proportions (specifically for the SaaS provider)
- scenarios for the VM proportions (specifically for the PaaS provider).
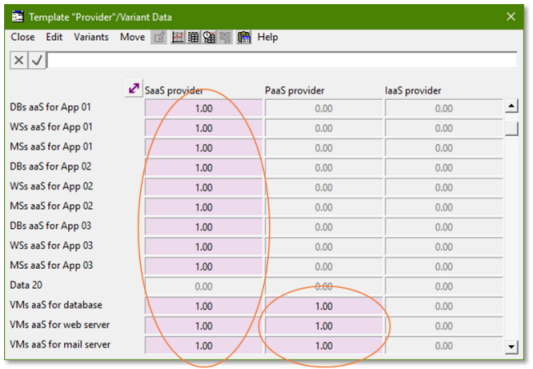
Figure 15: Scenario parameters for the provider-template build options
The ‘black and white’ scenarios like SaaS on IaaS
set these values to ones or zeroes. In contrast, the Hybrid
cloud scenario for SaaS features a mixture of internal and
aaS at each level as shown below.
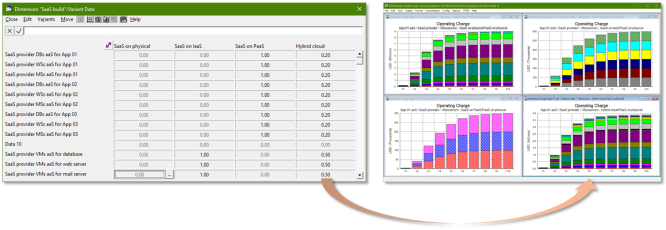
Figure 16: Scenario values and associated results for the SaaS build options
Next steps
The focus of this exercise was to consider different commercial models in the cloud
era. The model does not go into any technical detail about the internal configuration
of a data centre and this level of textbook STEM modelling is left as an exercise
to conduct in private with individual clients. The modelling framework itself could
be further layered to differentiate between data centre tenant, facility provider
and building landlord.
Various applications were explored at the
STEM User Group Meeting in October 2016, including the delivery of network
virtual functions or a managed backup service. There is no doubt that the ascent
of software-defined networking promotes an increasing layering and range of actors
and opportunities in the connected landscape.
Implied Logic can work with you to customise this methodology to your individual
market and current network position in order to fast track a credible financial
assessment of your strategic options.
This framework was first presented at the
Networks 2016 conference in Montréal on 26 September 2016. The supporting
paper, Elements of techno-economic modelling for the planning,
provisioning and operation of virtualised networks, is published on IEEE Xplore and some portions of the text above
are © 2016 IEEE.