 Now
that STEM 7.1 is out on general release, we have turned our minds to the next round
of STEM development. We polled a random selection of users to get their top-ten
most annoying features of STEM as a good way to focus our attention on ways that
we can improve the STEM experience for everyone. Not surprisingly, the almost universal
priority is to make the software easier to learn and hand over to colleagues, and
to that end we are planning a STEM 7.2 release for April 2008 which will address
many of the most common complaints.
Now
that STEM 7.1 is out on general release, we have turned our minds to the next round
of STEM development. We polled a random selection of users to get their top-ten
most annoying features of STEM as a good way to focus our attention on ways that
we can improve the STEM experience for everyone. Not surprisingly, the almost universal
priority is to make the software easier to learn and hand over to colleagues, and
to that end we are planning a STEM 7.2 release for April 2008 which will address
many of the most common complaints.
The headline features of STEM 7.2 will include free text in views in the Editor,
a new wizard for exporting results to Excel, and automatic selection of column/bar
format for charts of aggregate measures such as revenue, traffic volume and cost
(leaving end-of-period measures as line charts). Numerous enhancements will include
refined toolbar and drag-and-drop interfaces, an average subscribers demand basis
for services, direct access to notes from icons, simpler formatting for exported
model inputs, and a stem.tips email list.
At the same time, behind the scenes we are also looking into more fundamental enhancements
which will pave the way for an altogether more powerful and modern-looking STEM
8.0, nominally scheduled for release in April 2009. The aim in both cases is to
demonstrate and gain feedback on early prototype functionality at the STEM User
Group Meeting in the September, and to have initial beta-release software available
by the following Christmas.
Free text in views in the Editor
One clear requirement is to make it easier to explain to colleagues how a STEM model
works. Of course, if you are already familiar with STEM, then the icon names and
automatic links make a model almost self-documenting. But if you are not, then a
few concise notes in the relevant areas of a view, or attached to the icons, will
make it much easier for someone to follow your ideas, and more immediately apparent
than the existing notes on the embedded data.
Adding free text to explain a view
The detailed specification is still in progress, but we envisage text boxes comparable
to those found in MS Office applications, which will be moveable, sizeable, and
with control over text colour, font and background colour. We also plan to include
free-floating arrows to link text to individual icons, groups of icons, or colour
blocks.
A text box will be created from a new text tool, and then a click-and-drag in the
desired view. This feature ties in with some other planned simplifications. The
toolbar will no longer drop icons at the bottom left of the screen, but wait for
a second click so that you can position the new icon directly.
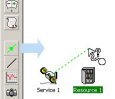
 The
drag-and-drop interface for creating relationships between elements will be enhanced
with target highlighting (so that you know when you are ‘in the right place’). In
addition, a new ‘data link’ button will enable you to link elements by clicking
on the toolbar and then dragging a linking line from one element to the other.
The
drag-and-drop interface for creating relationships between elements will be enhanced
with target highlighting (so that you know when you are ‘in the right place’). In
addition, a new ‘data link’ button will enable you to link elements by clicking
on the toolbar and then dragging a linking line from one element to the other.
In addition, the ‘drop’ interface for Transformations will be extended to allow
the type to be changed to Expression on demand, and to link directly to the next
free input.
Results export wizard for Excel
Having completed the Excel link generation function from the STEM Model Editor in
STEM 7.1, there is a clear parallel benefit to automating the generation of Excel
results interfaces too. The basic intention is that you should be able to ask STEM
to create an Excel workbook containing all the data from a chart in the STEM results
program, or from all the charts in the current view, or from selected views in the
current workspace. In other words, we will use the existing graph selection interface
as the wizard element for selecting data to send to Excel.
Exporting STEM model results to Excel
Just as the export of model data from the Editor is primarily intended as a way
to create dynamic input links, so we plan to create Excel sheets which will link
their data dynamically from STEM (using the STEM add-in toolbar for Excel) in such
a way that they can be updated automatically after you re-run the underlying model.
All the data from a given view will be written to a single worksheet with the same
name as the view, and you will have the option to choose separate sheets when exporting
multiple views. STEM will offer to write subsequent exports onto new sheets in a
previous export workbook if you so wish.
Automatic column-format selection for charts of aggregate measures
With one or two exceptions, most of the standard graphs in STEM are defined as line
charts, for maximum flexibility when charting multiple elements and scenarios on
the same graph. However, for charts with just a few elements or scenarios it is
generally clearer to show aggregate measures such as revenue, traffic volume and
cost with columns or bars (especially as this has the additional benefit in STEM
of allowing variable column widths for quarterly and monthly results). Most users
routinely re-format such charts each time.
Instantaneous and aggregate values
Now we propose to introduce preferred column and bar format types which will automatically
show simple charts as column or bars respectively, while reverting to line (or possibly
squared line) format for anything ‘too complicated’ (a criterion yet to be precisely
defined!).
Other simplifications in the Editor and Results programs
|
Editor
|
Results
|
- Percentage operator
- Market Segment size to show time-series button rather than constant dialog, and
similar for Location sites and Cost Index cost trend
- Direct access to create top-level notes from icons
- Better accelerators for running scenarios and sensitivities
- An average subscribers demand basis for Services
|
- A default results workspace to auto-create a range of charts from scratch for new
models
- Consolidation of quotient results
- New result to show the number of Resource units decommissioned early
|
|
General
|
- Clearer formatting for exported model inputs
- A help button for the STEM add-in toolbar for Excel
- Clearer error messages and highlighting of the status bar when an error occurs
- Simpler example models
- A stem.tips email list for exchange of modelling and practical advice
|
This is where we are headed, and we seek your input
Of course, our plans may change as other requests are added, but this article should
give a clear indication of our focus and priorities for STEM 7.2. The intention
is to share our ideas at the earliest stage in order to stimulate further discussion,
and to gain feedback from our customers on the overall directions indicated.
You can discuss these topics with us directly at the STEM User Group Meeting, 19–20
September 2007 at Corpus Christi college in Cambridge, UK.
Now read on to find out about our
more radical plans for STEM 8.0.