It is always easier to focus on the physical aspects of infrastructure when constructing
a cost model because many of the technical parameters are already written down and
the biggest uncertainty may be the original pricing. In contrast, it is much harder
to get data on all the tasks encompassed under the headings of service provisioning
and operation, and still harder to estimate them across the relevant staff, and
to make realistic allowances for learning curves and multi-tasking.
The associated calculations of tasks per period, hours per period per resource,
and dollars per hour per resource are not exactly ‘rocket science’,
but are prone to error when switching between annual and monthly views. The increasing
dominance of staff-related opex was anticipated in our technology roadmap some years
ago, and was the driving factor for adding end-to-end support for aggregate measures
(such as configuration-task hours) across all of our modelling platforms (as documented
in earlier newsletters).
 In this article we set out a generic methodology and foundation for the core calculation
structure and drivers, leaving you to focus on the data requirements and analysis
which is where the real learning and insights lie.
In this article we set out a generic methodology and foundation for the core calculation
structure and drivers, leaving you to focus on the data requirements and analysis
which is where the real learning and insights lie.
1. Quantifying the scope of tasks and required skillsets
A key part of the virtualisation story for networks is automation, i.e.:
- the ability to commission and maintain services without recourse to an underlying
hardware layer
- the potential to turn-up capacity on-demand with no manual input.
For a business case to reflect these operational benefits, it is essential to capture
the effort associated with the full range of fulfilment and assurance tasks:
- first in a conventional network hardware configuration, and then
- in one or more virtualised scenarios for comparison of cashflow, profitability and
NPV.
As well as the overall effort per task, per new or existing customer, a mapping
across specific roles will yield more detailed insights if there is empirical evidence
to back it up:
- customer-service agent, network engineer, data-centre IT support, virtualisation
architect, network security consultant
- team lead, senior management
- facility services and security.
It is not just the allocated hours that count, but the hourly rate for each individual.
If available, it is preferable to calibrate a model with this level of detail:
- to reflect operational nuances
- to understand the relevant drivers and dependencies
- to consider minimum staffing levels at any given site –
see next section below.
Otherwise, the more pragmatic approaches are either:
- to work with a single effort estimate per task, at an averaged labour rate, or
- to break down the grid of tasks into specific tasks per individual staff type.
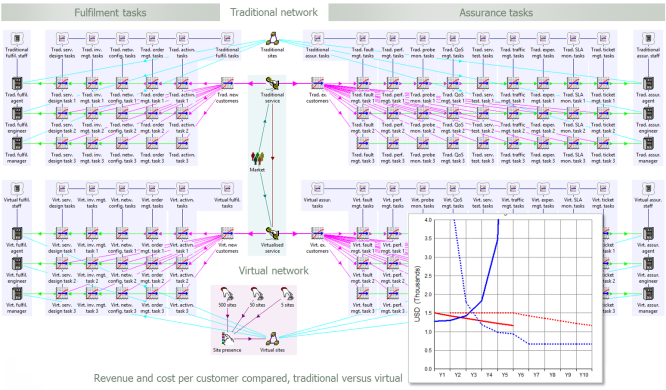
Figure 1: Labour costs per new customer and per existing customer
1.1 Fulfilment tasks for new customers, or new services
A service provider typically has a whole process1
for the addition of
a new customer:
- service design and cataloguing
- integrated inventory management
- network configuration and capacity assignment
- service order entry, decomposition, workflow tracking and fallout resolution
- service order activation.
Each of these headings evidently represents potentially numerous sub-tasks.
As well as the material impact of these tasks (such as storage, contract documentation,
postage, and so on) the most expensive aspect is usually the labour effort. In order
to support a dynamic model, it is essential to provide assumed average hours per
task:
- benchmarked against historical volumes, and
- sanity checked ‘from the top down’.
Note: ideally a model will distinguish between customer acquisition and incremental
service orders, but this is beyond the scope of the current article.
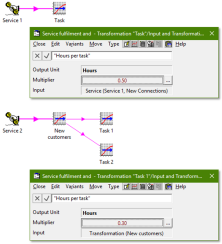 This
is easy to capture as a single STEM transformation with inputs:
This
is easy to capture as a single STEM transformation with inputs:
- Basis = New Connections
- Multiplier = <hours per task>.
However, if we expect to model many tasks, then the common logic will be more transparent
(and robust) if we make the New Connections aspect explicit
first as a separate transformation.
This can then drive each of the separate per-task assumptions without having to
repeat (or check) the basis each time.
1.2 Assurance tasks for existing customers, per month
There are numerous activities2 that a pro-active service provider may
schedule to keep a customer loyal:
- fault and event management
- performance management
- probe monitoring
- QoS management
- network and service testing
- network traffic management
- customer experience management
- SLA monitoring
- trouble ticket management.
This list is a useful checklist; even if not all are relevant in every case, there
is no harm in showing a zero to confirm that this item has been considered.
Again we need to estimate the associated labour effort. For existing customers,
this must be defined as hours for a given task per month
(or whatever). Since this will be used to calculate a cumulative volume of effort
in a period, the calculation should be:
- average connections ×
- months in period ×
- task hours per month.
Some lower priority tasks may be skipped at busy times in practice. This could be
modelled as a scenario if necessary.
In this case we need a transformation with input Basis
= Average Connections. But how should we capture the per
month aspect of the effort?
Answer: the Time Factor transform, introduced in STEM 7.3:
- provides a built-in Multiplier Period input which
qualifies the effort assumption in time
- scales an hourly task estimate by the number of hours in the period
- generates an aggregate output, even though the calculation is driven from the instantaneous
Average Connections basis.
In both cases we are calculating a volume of hours which must be worked in a given
period. This must be connected, in some sense, to a relevant cost per hour.
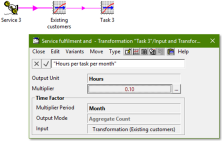
1.3 Grouping the two categories of tasks and sub-tasks
Since we have already identified a menu of tasks in each category, it will be helpful
to use a collection to identify total task hours for both fulfilment and assurance.
More generally, as we drill down into each activity area, we may wish to use another
collection to report on all sub-tasks under a given heading, as shown below.
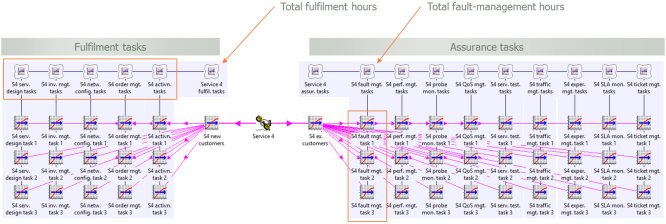
Figure 2: Using collections to group and aggregate the two categories of tasks and
sub-tasks
1.4 Mapping tasks to relevant skillsets for detailed costing
The simplest way to infer a man-power cost is to ascribe a single labour rate across
the board. However, this ignores the fact that senior-engineer time is likely to
be rather more expensive than that for a customer-service agent.
In principle the effort from each task should be allocated across the relevant contributing
roles (so long as reliable data is available). More compactly, the sub-tasks may
naturally be split by role in the first place, avoiding the need for a ‘fiddly,
intermediate matrix’.
Contract labour or employees
If the relevant effort is outsourced, then a rate per hour may suffice; this can
be conveniently entered as a consumable resource.
However, if you maintain your own operational teams and are concerned with headcount
and utilisation, then:
- you may prefer to use a persistent resource to
represent an employee
- its capacity may be entered with a time factor
(to infer the available effort per period), which allows it to be driven by aggregate
hours
- the unit cost is then the associated annual/monthly salary + overheads.
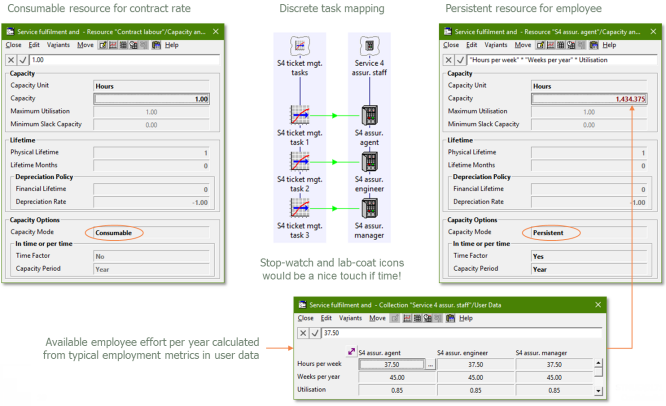
Figure 3: Consumable resource for contract rate versus persistent resource for employee
1.5 The operational benefits of a transition to virtual networking
We have discussed a general framework for modelling service fulfilment and assurance
tasks. Now we need to outline a context within which we can demonstrate a revenue/cost
delta between traditional and virtual networking.
We will consider an existing service which is in decline:
- unprofitable due to price erosion
- unpopular due to lack of agility.
Imagine migration to a new, virtual service equivalent:
- postpones revenue decline
- increases market share.
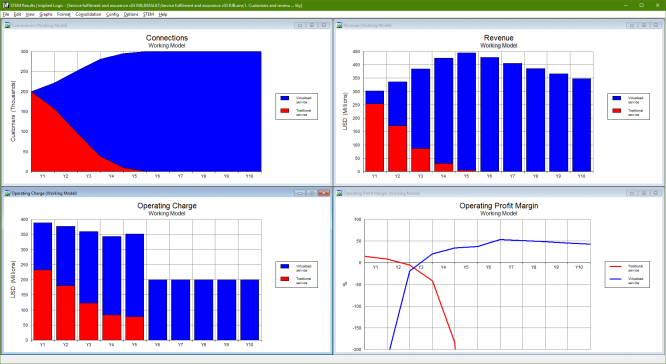
Figure 4: Service results: customers, revenue, cost and profit margin
This model fragment is concerned only with customer revenue and staff costs, so
the key results are:
- revenue trajectory for each service
- headcount
- comparison of assurance costs, both total and per customer
- impact of new service fulfilment relative to ongoing assurance costs
- profit margin per customer.
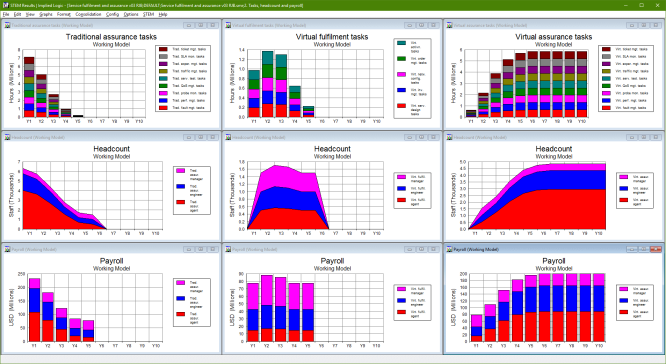
Figure 5: Task hours, headcount and payroll
1.6 Revenue and operating charge per connection
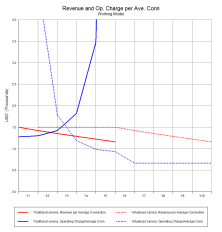 The traditional service revenue is declining at 5% p.a.. At the same time, the
allocated cost is increasing (partly aggravated by declining scale). In contrast,
we hypothesise that the agility of the new, virtual service delivers two benefits:
The traditional service revenue is declining at 5% p.a.. At the same time, the
allocated cost is increasing (partly aggravated by declining scale). In contrast,
we hypothesise that the agility of the new, virtual service delivers two benefits:
- price premium defies the usual decline for a period of five years
- market share is increased.
The allocated cost is higher during the transition, but the assurance base is lower
and further benefits from the increased scale.
2. Sites for hardware tasks vs virtual = hidden cost
If you have network intelligence configured in hardware across a distributed network,
then you must have engineers at many sites to configure it.
If you consolidate these scattered platforms to a small number of data centres,
then you can expect to achieve higher utilisation in the equipment, but you still
need people at each site. Moreover, for practical reasons, these fewer sites are
likely to be spread out across the territory, so separate teams remain a necessity.
In a virtualised architecture, you may need some core expertise to maintain ‘utility
IP connectivity’ at each site, but any virtual service may be fulfilled and
monitored from a single, central network operations centre (NOC).
(This is true, at least in principle, and as long as everything works correctly,
but it is imperative to consider failure scenarios.)
This critical ‘sites assumption’ and very real overhead factor for operational
resourcing is easily overlooked, especially when considering the business plan for
a new entrant. Thus, a virtualised future may lower barriers to entry and lead to
increased competition.
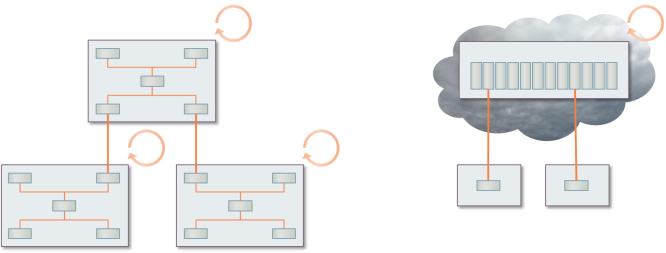
Figure 6: There could be fewer nodes, but a virtual service may be orchestrated
from a single NOC
2.1 Demonstrating the cost savings from a reduced site count
On the current numbers, we have around 5000 staff for each service, serving around
200k customers across 500 sites:
- that’s a ratio of around 1:40
- an average of 10 staff per site.
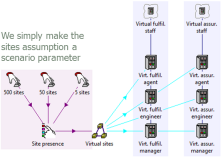 Considering that an SDN solution can be mostly managed from a central NOC, let’s
consider the impact of a reduction from 500 to 50 or even 5 sites:
Considering that an SDN solution can be mostly managed from a central NOC, let’s
consider the impact of a reduction from 500 to 50 or even 5 sites:
- we expect staff utilisation to be higher when less dispersed (see results below)
- it is interesting to see the actual headcount required in each case.
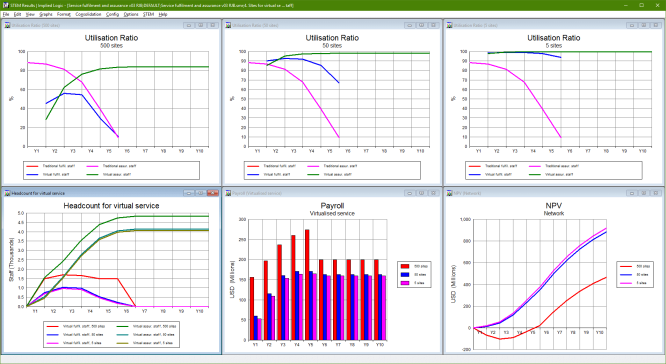
Figure 7: Demonstrating the cost savings from a reduced site count
It makes a difference when going from many sites with under-utilised staff to fewer
sites with well-utilised staff. In contrast, only a marginal benefit arises from
further reduction of sites when staff utilisation is already ‘as good as it
gets’ at the median scale
3. Increasing focus on operational efficiency
It is entirely practical to model the economics of virtualised networks, including
cost and technology trends. Traditional hardware elements still exist, but with
standardised, low-complexity configurations. High speed networks can bring all the
intelligence to the data centre:
- compute, storage, networking
- per service/server licences
- orchestration platform licence.
This business transformation results in a reduced focus on capital efficiency:
- most of the long-term investment is in the safe bet of the data centre
- much of the virtual platform presents as an opex item.
As the network becomes more of a commodity, and with an increase in white-box solutions
and open source, the human operational costs will become more and more dominant
in future business plans. Whereas such costs are hard to estimate and were often
estimated in the past as ‘a % of capital’, we anticipate an increasing
interest in and demand for well thought-out and consistent approaches to opex modelling.
Demonstrating the net benefits of transitioning to SDN
STEM has already been used extensively to calculate the business potential of traditional
networks. By modelling the data centre, in conjunction with the associated operational
impacts, it is entirely feasible to evaluate the virtual network alternative:
- cost of deploying new platform
- uncertain learning curve for new mode of operation
- migration to white-box hardware
- conjectured reduced operational effort and associated dollar cost.
If you are really careful and thorough you can try to calculate the absolute cost
of each option. However, if your objective is to determine which option is better,
then it suffices to model what is different and look at an NPV
delta.
In practice there may be multiple dimensions to the decision making:
- what to do if such a market or technology eventuality occurs?
- which option is better in market A compared to market B?
- is being ‘first mover’ a curse or advantage?
Network economics has never been more relevant!
Implied Logic can work with you to customise this methodology to your individual
market and current network position in order to fast track a credible financial
assessment of your strategic options.
This framework was first presented at the
Networks 2016 conference in Montréal on 26 September 2016. The supporting
paper, Elements of techno-economic modelling for the planning,
provisioning and operation of virtualised networks, is published on IEEE Xplore and some portions of the text above
are © 2016 IEEE.
1 See
TM Forum (eTOM)
or
Wikipedia (Service fulfilment).
2 See
Wikipedia (Service assurance).