 Marco Cavalieri, a
Masters student at CEFRIEL in Milan, has performed a review of the technical specifications
for WiMAX and has researched the associated regulations and trial results. In this
article, which takes the form of edited extracts from his report, we provide a possible
business model of this technology, which builds on a related Masters project from
last year: Nationwide implementation
of a WiMAX mobile access network.
Marco Cavalieri, a
Masters student at CEFRIEL in Milan, has performed a review of the technical specifications
for WiMAX and has researched the associated regulations and trial results. In this
article, which takes the form of edited extracts from his report, we provide a possible
business model of this technology, which builds on a related Masters project from
last year: Nationwide implementation
of a WiMAX mobile access network.
The basic business conditions and the major characteristics of the original model
are updated and improved. In particular we define a more accurate path-loss model
and look at tariff management in more detail. New network elements are added for
a more comprehensive picture of the network.
Business model structure
The main STEM WiMAX mobile model is depicted below. It is easy to identify the market
(CovSub), the services (IPBrows, MMS, VoIP, VidConf, RCM, Streaming, Gaming), and
the resources for the services (RFLicence, EdgRoutNMS, BackHLnk, BSBA, Sector, InfrStrct,
CPE). At the top of the view are the replicated icons that represent the location
type (UR, SU, RU). The transformation icon (TotMbpsReq) calculates the total bandwidth
required by each service and the variant icon (Channel) represents the two channelisation
variants. In the following sections, each element is described in more detail.
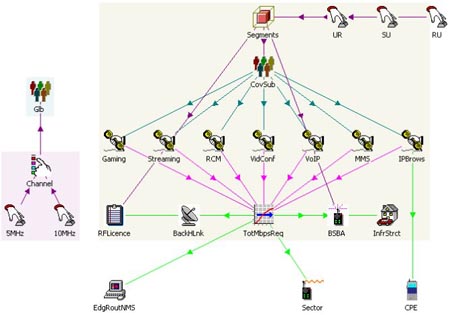
STEM WiMAX mobile model (Source: CEFRIEL)
Market
The market segment of our business model is based on the Italian population. The
list of the 8101 municipalities is derived from the ISTAT database, along with the
area and population density of each. The list is sorted in order of decreasing population
density, and divided into three different segments, associated with the urban, suburban
and rural environments, respectively:
- urban: population density ≥ 1000 inhabitants per square kilometre
- suburban: 200 ≤ population density < 1000 inhabitants per kilometre
- rural: population density < 200 inhabitants per square kilometre.
The number of municipalities in each segment, the population, and the area, are
summarised below. The three population segments represent the potential subscribers
for each environment.
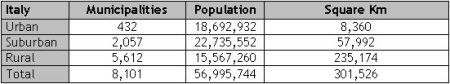
Italian population (Source: CEFRIEL)
At this point we have to consider two factors, the covered proportion of population
and the covered proportion of territory, and it is clear that under realistic conditions,
a linear function between them does not exist. However, in our analysis, for simplicity,
we have assumed a linear approximation (coverage proportion population = coverage
proportion territory), so the coverage factor converts a potential subscriber into
a reachable subscriber.
The reachable subscribers generate demand for a service proportionally to an assumed
penetration level. The traffic demands of broadband subscribers are expected to
grow steadily throughout the study period, which is fixed at ten years.
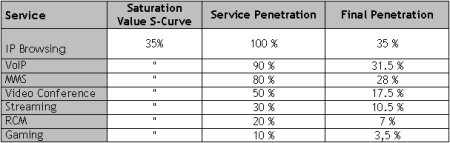
Service penetration (Source: CEFRIEL)
Service description
The next step for the definition of the model is defining the services offered,
which are listed below.
|
IPBrows (IP browsing)
|
A collection of services that includes Web browsing, always-on email, and remote
LAN access
|
|
VoIP (voice-over-IP)
|
A voice service delivered using Internet Protocol
|
|
VidConf (video conferencing)
|
A service that allows individuals or groups to meet face-to-face in real time and
to interact
|
|
MMS (Multimedia Messaging Service)
|
A service that allows users to exchange multimedia communications between multimedia-enabled
mobile phones and other devices. It supports text, picture and video messaging
|
|
RCM (Remote Control Monitoring)
|
A service with which the users can control and monitor equipment in remote locations
|
|
Gaming
|
An online, multiplayer gaming service
|
|
Streaming
|
A service that provides short video clips. Note that a broadcast technology such
as DVB-H is much more appropriate for a full movie service
|
IP browsing
Each service has a specific penetration level within the market segment. The penetration
of the other services is expressed as a portion of IP browsing penetration, IP browsing
being assumed to be a base service with 100% penetration. Resource demand is driven
by the traffic in the busy hour, according to the parameters listed below.
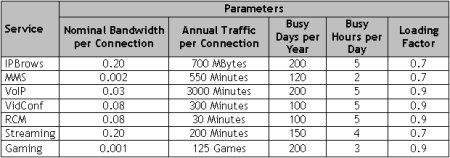
Service parameters (Source: CEFRIEL)
Resource planning
A simplified network scheme could consist of: an Edge Router and a Network Management
System (EdgRoutNMS), a Backhaul Link (BackHLnk), Base Stations (BSBA) with associated
Sectors (1–6) and a cost allocated for their physical infrastructure (InfrStrct),
and customer premises equipment (CPE). The effective capacity of the base station
depends on the overall coverage plan, and, for the same reason, the infrastructure
capacity is not mentioned because it is strongly linked with the number of base
stations. An RF Licence also exists but it has to be counted as intangible, rather
than tangible, equipment because it does not represent a fixed asset for the deduction
of depreciation. The licences are usually assigned by an auction involving all the
interested cellular operators. The most common indicator of bidder valuation is
the ˆ per MHz per population criterion (ˆ/MHz/Pop.). This is the amount being offered
for a spectrum lot divided by both the size of its bandwidth and the number of people
living in its geographic area. The relationship between licence value and population
size is not usually linear, because it also depends on the population density.
Within the resource planning lies the key variable used to generate the two principal
different scenarios evaluated in this report: the ‘channelisation’. Using orthogonally
polarized signals, the number of channels available effectively doubles. With these
assumptions, our scenario can be realized allocating two frequency bands per operator
(uplink and downlink). The choice of channelisation depends on local regulations:
here, two different channelisations, 5MHz and 10MHz, are evaluated, with a total
spectrum allocation of 20MHz and 40MHz respectively. These choices allow more than
one operator to utilize the available spectrum.
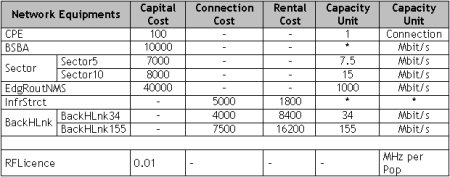
Network equipment costs and capacities (Source: CEFRIEL)
Path-loss models for wireless channels
Propagation models are used extensively in network planning, particularly for conducting
feasibility studies and during initial deployment. They are also very useful for
performing interference studies as the deployment proceeds. These models can be
broadly categorized into three types: deterministic, stochastic, and empirical.
The deterministic models make use of the laws governing electromagnetic wave propagation
to determine the received signal power at a particular location. They often require
a complete 3D map of the propagation environment, such as a ray-tracing model.
Stochastic models model the environment as a series of random variables. They are
the least accurate but require the least information about the environment and use
much less processing power to generate predictions.
Empirical models are those based on observations and measurements alone and are
used mainly to predict the path loss but also the rain-fade and multipath effect.
All empirical models can predict mean path loss as a function of various parameters,
for example distance, antenna heights, etc. They can also be split into two subcategories,
namely non-time dispersive and time dispersive, which are designed to provide information
relating to the characteristics of the channel.
Examples of non-time dispersive empirical models include the Hata and the COST-231
models, which were unified in the COST-231 Hata model. Examples of time-dispersive
empirical models include the Stanford University Interim (SUI) channel model and
the Erceg-Greenstein model, which are based on the same hypotheses but with slightly
different formulae. We use the Erceg-Greenstein model as the reference model for
this project.
Cell deployment
Cell deployment is fundamental to efficient coverage of all the regions without
any lack of service. For this reason, we have created an automatic and adaptable
cell deployment driven by two different parameters: the morphology of the covered
region and the total traffic generated by users.
First of all, we took into consideration the cell radii previously obtained using
the Erceg-Greenstein model, and calculated both the maximum and minimum number of
cells for the full coverage.
Then, we linked the information about the minimum and maximum cells for full coverage
through a geographical coefficient to finally achieve the real number of cells necessary
for coverage of the region depending on its morphology.
We obtained the total traffic expressed in MHz which each single cell has to support,
and then deduced which hardware could satisfy such capacity, implying how many sectors
would be required on a generic base station. We also calculated the average number
of sectors necessary to fulfil the cell capacity requirement.
Finally, we considered two different strategies for the sector equipment in each
base station, with a common starting point. The starting point is to install a base
station per cell with only one sector, i.e. an omni-directional antenna. Then, the
deployment proceeds depending on the maximum value of the average sectors per cell
in each environment obtained in the previous formula. For radio-planning reasons,
that entails a 2- or 4-sector base station under the first strategy, and a 3- or
6-sector base station under the second strategy. These two deployment plans are
dictated by the possible interference and the possibility that further RF planning
will be necessary.
The model separately considers these parameters for the urban, suburban and rural
segments.
Tariffs
The role of the tariff manager in a telecoms company is fundamental. (S)he has not
only to decide the right economic value to assign to a certain portion of bandwidth
but also has to stimulate the population to spend as much as possible on services.
We assume three different types of tariff (shown below): the first one is prepaid
and aimed at the basic consumer while the other two are flat and aimed at medium
and high-end consumers. Each table includes parameters, such as Nominal Tariff,
Revenue (calculated directly from the service traffic and the nominal tariff), and
the Discounted Revenue, (the reduced revenue as a result of discounts to encourage
consumers to take up the various offers).
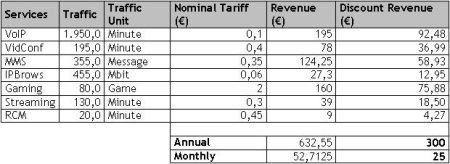
Reference tariff (Source: CEFRIEL)
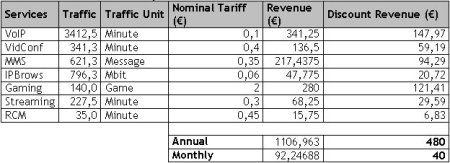
Medium profile tariff (Source: CEFRIEL)
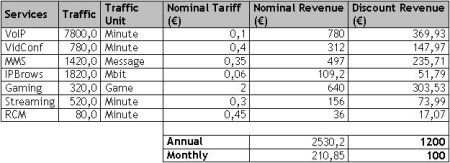
High profile tariff (Source: CEFRIEL)
We assume that the market shares of the tariff plans are 70%, 20% and 10% respectively.
This leads to the total traffic and the nominal and discount revenues shown below.
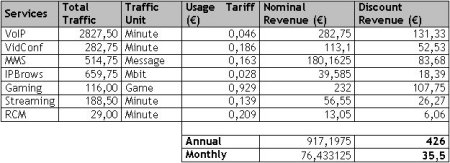
Global average tariff (Source: CEFRIEL)
Model results for 5MHz and 10MHz scenarios
The scenarios run for 10 years. Bearing in mind that, at a national level, more
than one licence is granted, the penetration of IP browsing (the base service),
expressed as an S-curve, has a saturation value of 0.35 in Year 10 (i.e. 35% of
the covered population is served by this operator).
The model calculates the capacity utilisation (Mbit/s used and slack) for each type
of location. Note that total capacity and used capacity are driven quite differently
and behave quite differently: total capacity is driven by cell deployment, and used
capacity is driven by bandwidth required (which in turn depends on the penetration
of different services). The difference between total and used capacity is the slack
capacity.
Both the base station capacity and the total spectrum allocation (20MHz for the
5MHz scenario and 40MHz for the 10MHz scenario) are fixed as inputs to the model.
Base station capacity is equal for all scenarios because of the cell planning strategy:
it adjusts itself to both the geographic and traffic requirement, apart from the
channelisations. In fact, the model parameter that will change is not the proportional
capacity utilisation but the number of frequencies used.
In the urban environment there is practically no slack capacity at the end of our
study period. Moreover, in both the suburban and rural segments, capacity usage
develops according to a similar trend curve, albeit with different limiting utilisation.
The resource that mainly differentiates the scenarios is the sector. For this reason,
we report in detail the sector deployment under the two channelisations to better
understand its evolution during the study period. In particular, it noticeable that
the sector curve in the 10MHz scenario perfectly follows the coverage factor. By
contrast, in the 5MHz scenario the sector trend is the same as that in the 10MHz
scenario until the end of Y2, but at the beginning of Y3, it proceeds with an irregular
increment driven by minor sector-capacity upgrades.
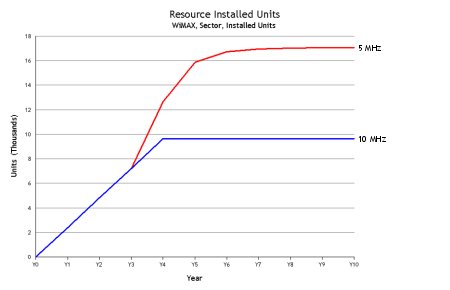
Installed sectors (Source: CEFRIEL)
Economic analysis
Using the predictions and assumptions introduced in the previous sections, economic
analyses can be carried out for different scenarios.
The revenues earned are shown in detail below. They are the same irrespective of
the channelisation. The VoIP service generates the highest revenue and exhibits
high penetration (90%). It generates even more revenues than IP browsing, despite
IP browsing having 100% assumed penetration, because IP browsing has a very discounted
tariff. By contrast, the RCM service is the least profitable service, because of
its low assumed penetration (20%).
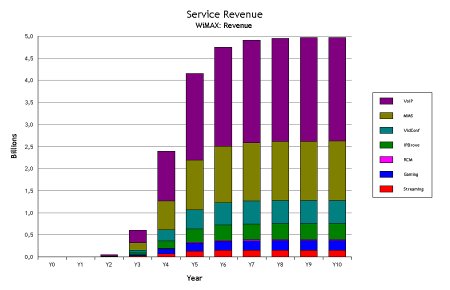
Annual revenue by service (Source: CEFRIEL)
MMS penetration as a proportion of IP browsing penetration has a saturation value
of 80% and has a large impact on annual revenue. Video conferencing has a saturation
value of 50% and revenues comparable to IP browsing. Finally, the gaming and the
streaming services have similar annual revenues, but have very different penetration
levels and tariffs. Gaming is a niche, relatively expensive service (10% penetration),
while streaming is cheaper and more popular (30% penetration).
The economic analysis takes into account the network charges compared to the revenues,
and an intuitive economic assessment shows positive benefits (revenues minus costs)
from Y4. However, a more accurate evaluation can be made from the NPV calculation,
which is a standard financial tool for planning long-term investments.
Conclusion and outlook
The 10MHz bandwidth variant seems to be the more suitable for providing broadband
services to mobile users because there are wider bandwidths with higher channel
bit-rate. The choice can be justified considering the service needs of a mobile
user: the broadband services requested from a portable device are different in bandwidth
usage from fixed-line broadband services.
It is clear that the model will have to be constantly updated because of the rapid
evolution of ICT market trends. Further analyses can also be carried out comparing
the results with a UMTS/HSDPA solution or another 4G solution.
The Center of Excellence For Research, Innovation, Education and Industrial Labs
(CEFRIEL) partnership in Milan was established
in 1988 as a partnership between organisations from academia, ICT business and public
administration. CEFRIEL is one of the main centres for technology transfer in the
ICT field, and a leading Italian player in ICT research, innovation and education.